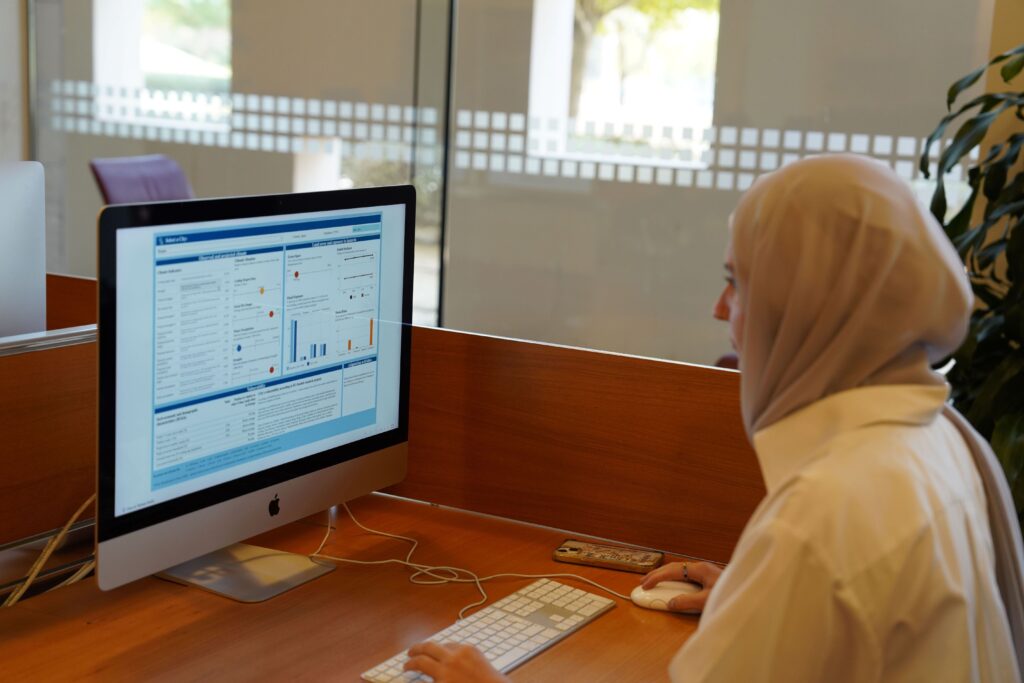
Data Visualization

The data visualization services empower students, faculty, and staff to transform complex data into compelling visual narratives. In today’s data-driven academic and professional environments, the ability to create clear, engaging, and informative visualizations is crucial. Our service equips you with the tools and skills needed to craft impactful visual representations of your data.
Services
Our team is here to guide you through the process of turning raw data into insightful visualizations. We offer support for a range of visualization tools and techniques. To support your data visualization journey, we offer:
Learning Resources
There are many learning resources to assist with self-learning at your own pace:
- LinkedIn Learning (videos)
- O’Reilly for Higher Education (videos and e-books)
Access to Library Databases
The library provides access to dozens of resources:
Software
The library supports software that can produce data visualizations, including:
- Tableau Public
- PowerBI
- Excel
- Google Sheets
Computing
The library provides computers with data visualization access, including:
- Tableau Public and Excel in the Innovation Lab
- Tableau Public and Excel in 1B09
- Excel in the Computer Commons
Workshops & Events
During the school year, there are workshops & events on a variety of topics. Check the workshop & event calendar to learn more.
One-on-one Consultations
The Innovation Lab has regular office hours with students experts who can assist you with accessing resources. During office hours, student experts can be found in the Innovation Lab in room 2B04.